Service Charges & Heating Costs Dashboard – Housing Associations
Transparent statements. Fair costs. Full control.
An AI-assisted platform that automates, verifies and makes explainable the entire service charges and heating costs cycle for housing associations, from invoice to statement. Every statement is correct and can be explained, within the frameworks of the Warmtewet and the Dutch Civil Code. Built for housing associations, and equally suited to property managers and professional landlords who settle service charges and heating costs. KAM advises, the human decides.
Book a demonstrationPlease note: all names, addresses, amounts and consumption data in the screenshots on this page are fictional (demo association "Horizon") and serve for illustration only. They cannot be traced to real people, tenants or housing associations.
Sign in · This is where the dashboard begins

Service Charges & Heating Costs—Housing Associations
Welcome back
Log in to your administrator account
Trouble logging in? Get in touch
© 2026 BNK KAM. All rights reserved.
KAM supports and accelerates your work, but makes no final legal or financial decisions. The final check and approval always rest with an authorised member of staff.
Act I · The problem
A tenant disputes the heating costs statement.
The member of staff has to go back manually to the supplier invoices, the meter readings and the allocation key to reconstruct how the amount came about. That takes hours and does not always produce a watertight explanation. And it is not a one-off, it is the daily reality.
Hundreds of invoices, thousands of homes, one strict law.
A housing association processes hundreds of invoices each year for cleaning, grounds, energy, water and heat, and has to allocate them fairly and verifiably across thousands of homes, within the frameworks of the Warmtewet, the Dutch Civil Code and the service charge assessment of the Huurcommissie. Invoices arrive separately per supplier and complex, in a range of formats. Allocating costs manually with the correct allocation key per cost type is labour-intensive and error-prone. A single calculation error or an unclear allocation key leads to disputes, corrections and a loss of trust.
An indicative sketch of a bottleneck widely recognised across the sector.
Why existing approaches fall short
Spreadsheets are flexible, but error-prone, not auditable and without built-in Warmtewet logic. Standalone accounting or property packages are strong on administration, but not built for service charge allocation, verification and explanation to tenants. Manual processes rely on individual knowledge, which disappears the moment a member of staff leaves. The Service Charges & Heating Costs Dashboard combines invoices, meter readings and allocation keys in one platform, checks automatically for anomalies and makes every statement explainable.
Act II · The platform
Not an accounting package. A specialised working environment.
The Service Charges & Heating Costs Dashboard is a complete platform for the service charge and heating cost administration of housing associations. It is not a replacement for your accountant or lawyer. It automates, monitors and provides insight into the entire cycle, from invoice and meter reading to allocation, statement and explanation, so that every statement is correct and can be explained.
For property managers too
The dashboard is designed for housing associations, but the same engine works for property managers and professional landlords. If you manage rented property and settle service charges and heating costs with tenants, the dashboard brings together your invoices and meter readings, allocates the costs using the correct allocation key and makes every statement traceable and Warmtewet-proof, exactly as it does for an association. The human stays in control through the four-eyes principle.
A deliberate boundary: the human decides
KAM is advisory and supportive, not an autonomous decision-making system. Every sensitive outcome, such as a finalised statement, requires human approval through the four-eyes principle. All AI outcomes are traceable and carry a source reference, and every action is recorded in an audit log. That is not a limitation, it is the reason you can trust the platform.
Everything at a glance
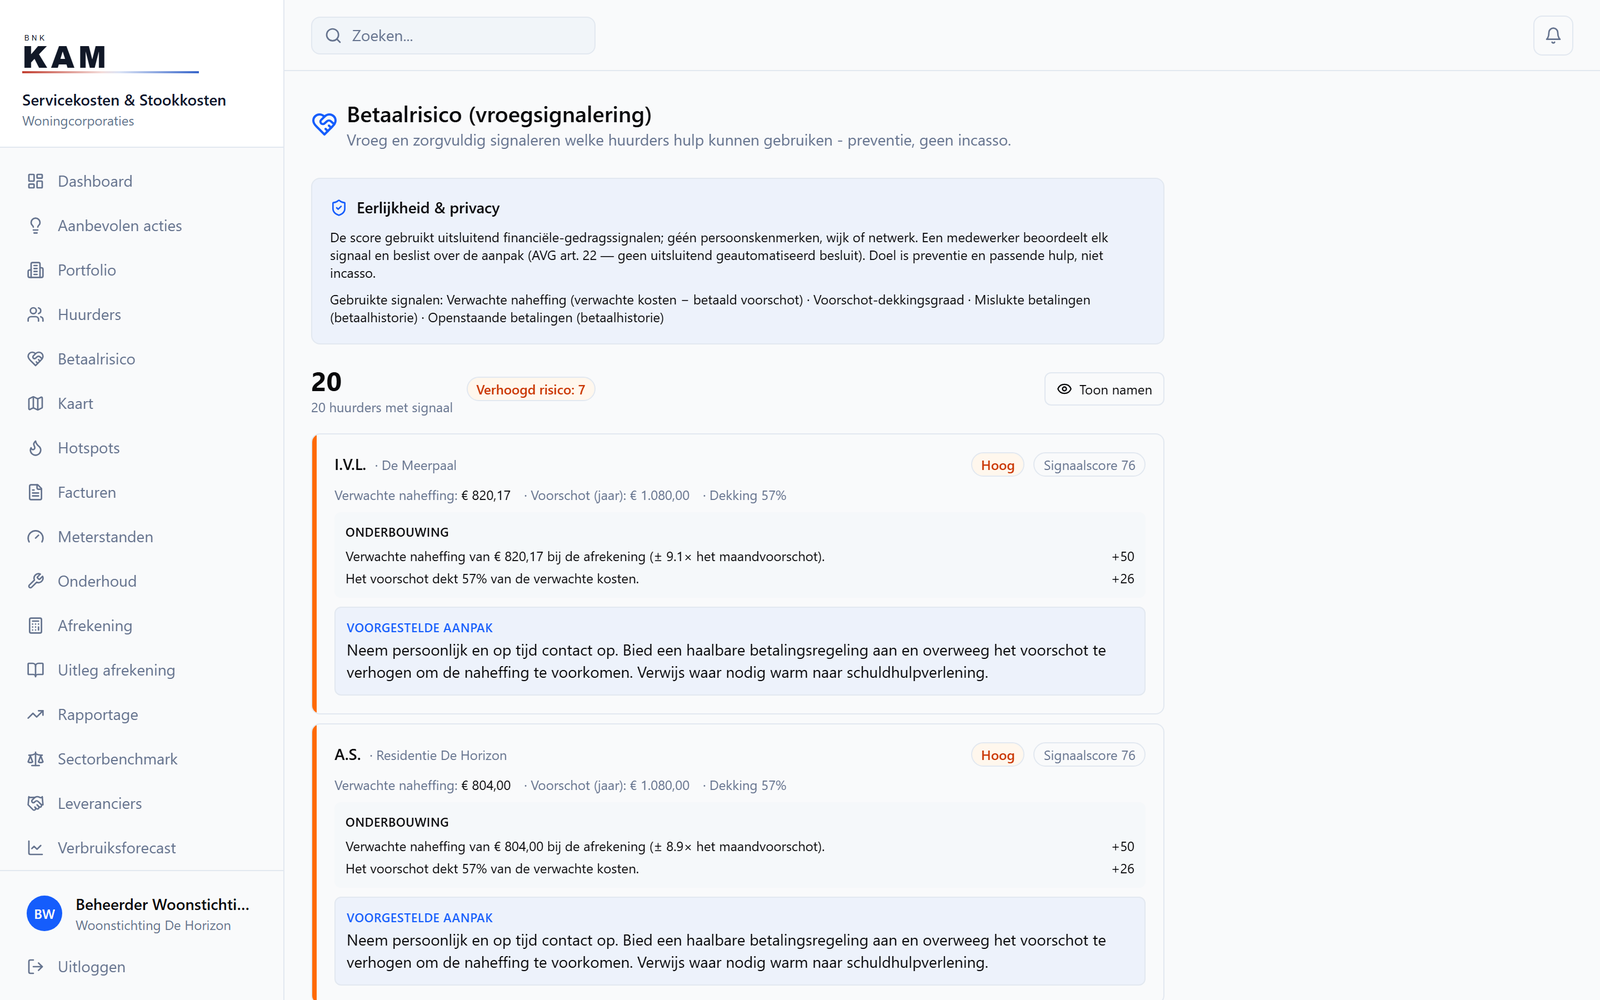
The dashboard brings complexes, homes, tenants, costs and the status of statements together on a single screen. Concrete, prioritised recommended actions point you straight to where you resolve them. That way you know each morning what needs attention.
What this gives you: overview of and control over the entire portfolio, without switching between tools.


Act III · KAM, the engine
KAM is not a black box. A set of built-in safeguards.
KAM is the AI architecture that makes the dashboard fundamentally different from an ordinary administration package. Every query and every AI action runs within a set of built-in safeguards that always apply, never optional and never bypassed. That is the guarantee of quality and safety.
Input monitoring & PII masking
Automatically recognises and masks personal data (BSN with eleven-test, IBAN, email, telephone, postcode) before any further processing.
Injection & manipulation detection
Detects and blocks attempts to mislead the AI or bypass its configured instructions.
Grounding in real data
Bases every answer on your own, current records, invoices, meter readings and portfolio, not on assumptions.
Source-linked knowledge base (RAG)
Retrieves relevant knowledge on the Warmtewet, service charges and tenancy law, each time citing the source.
Reasoning or safe fallback
With an AI key, KAM reasons through the language model; without a key, the system falls back to a deterministic calculation on the same data. It always works.
Output validation
Checks the answer for unmasked personal data and for empty or unsafe output before it reaches you.
Human verification (four-eyes)
Sensitive actions, such as finalising a statement, require explicit approval by a second person.
Organisational memory
Recorded knowledge and decisions are retained, so the platform becomes smarter the longer your organisation uses it.
Why this is unique
These safeguards work together as one whole: security, knowledge and control are not bolted on afterwards but built in. The four-eyes verification is technically enforced, so the AI never decides on a statement on its own. And the platform works without an external AI service too: thanks to the deterministic fallback on your own data, it stays usable and verifiable at all times.

Act IV · The modules
Nineteen modules that feed one another
Invoices and meter readings come in, the engine allocates and calculates, the statement is checked and explained, and KAM ties it all together. Below is the core of the cycle, each with a real screen from the running application. Swipe through the modules, or tap one.




Management & platform


Act V · In practice
From invoice to statement, with agents doing the heavy lifting
The cycle runs all year round. Invoices and meter readings come in, the engine allocates, and at the end of the heating season the statement is ready. Two agents take the heavy work off your hands, but always within fixed calculation rules and with the human having the final say.
The annual statement, with an Autopilot that checks itself
At the end of the heating season, the Statement Autopilot independently prepares a complete service charge statement per complex and year: it gathers invoices, homes, active tenants and meter readings and generates for each home a draft line with share, advance payment and balance. The agent works with fixed, verifiable calculation rules, no black box, and runs a self-check, for example whether the sum of all shares equals the total costs. Every draft is set to "awaiting approval", so a member of staff always gives the final approval.
What this gives you: a great deal of manual calculation saved, while the figures stay transparent and verifiable.

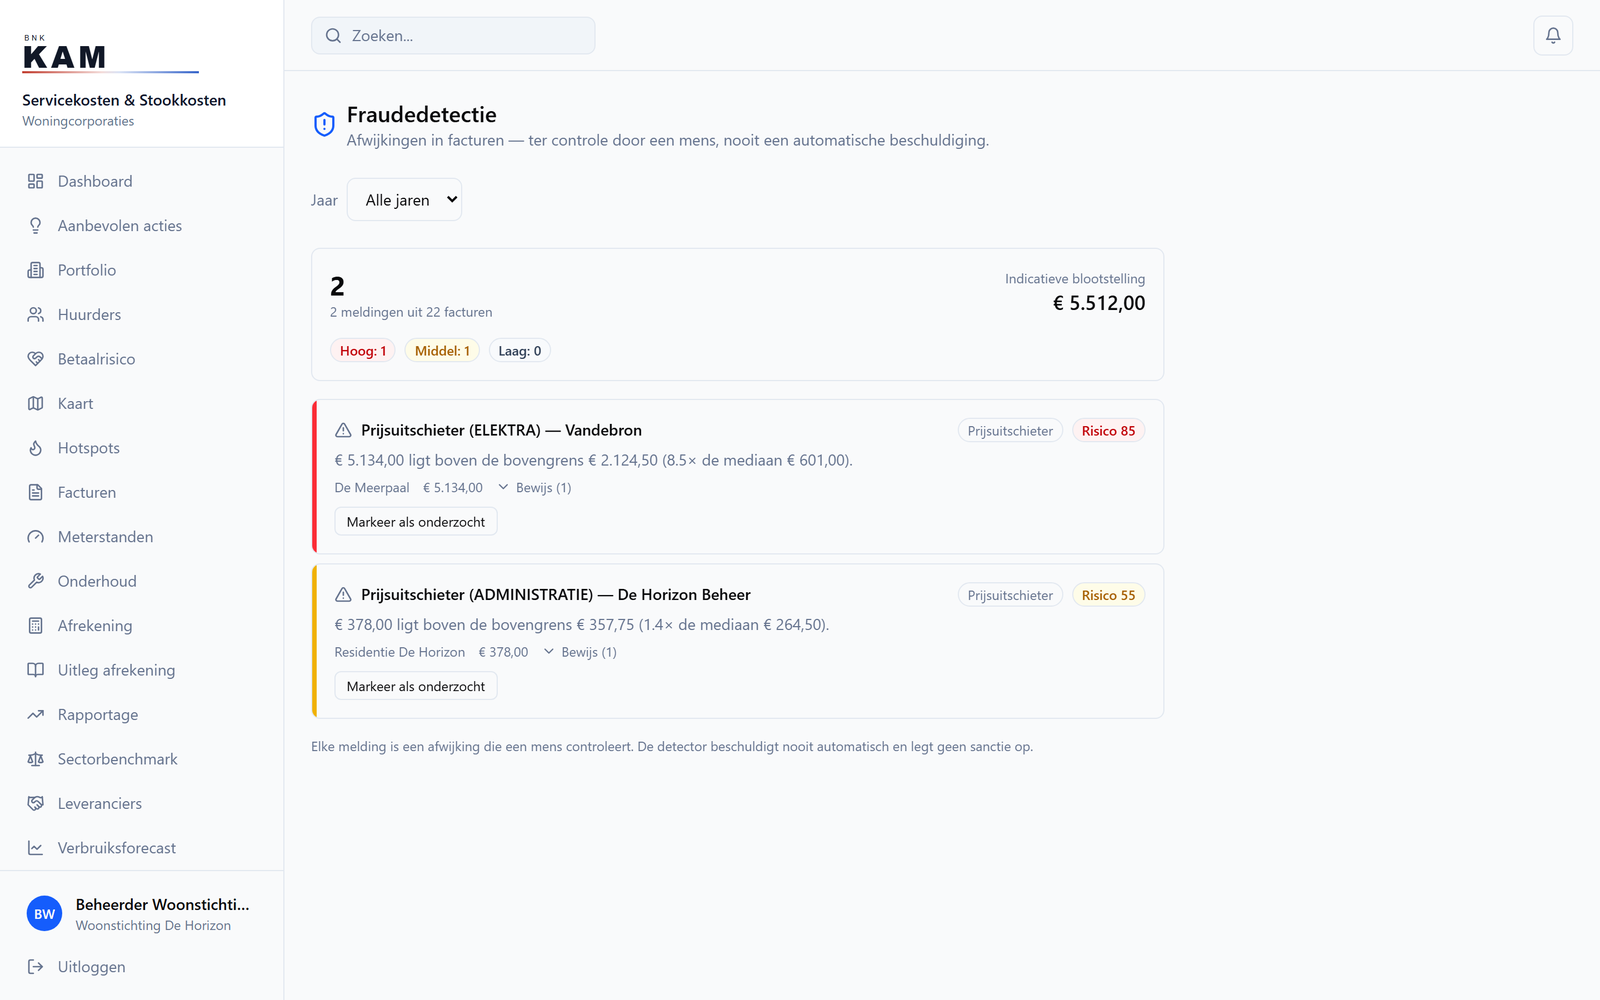
Spotting anomalies and fraud in good time
A supplier invoice looks higher than expected. Is it correct, or is there an error or irregularity? Fraud detection makes suspicious patterns in invoices and consumption immediately visible, with substantiation. The Why analysis also breaks down, per complex, why the costs are what they are, with a euro effect and an explanation for each cost driver, traced from your own invoices.
What this gives you: anomalies found before they end up in the statement, explainable with substantiation.
Smart features that turn your own data into insight
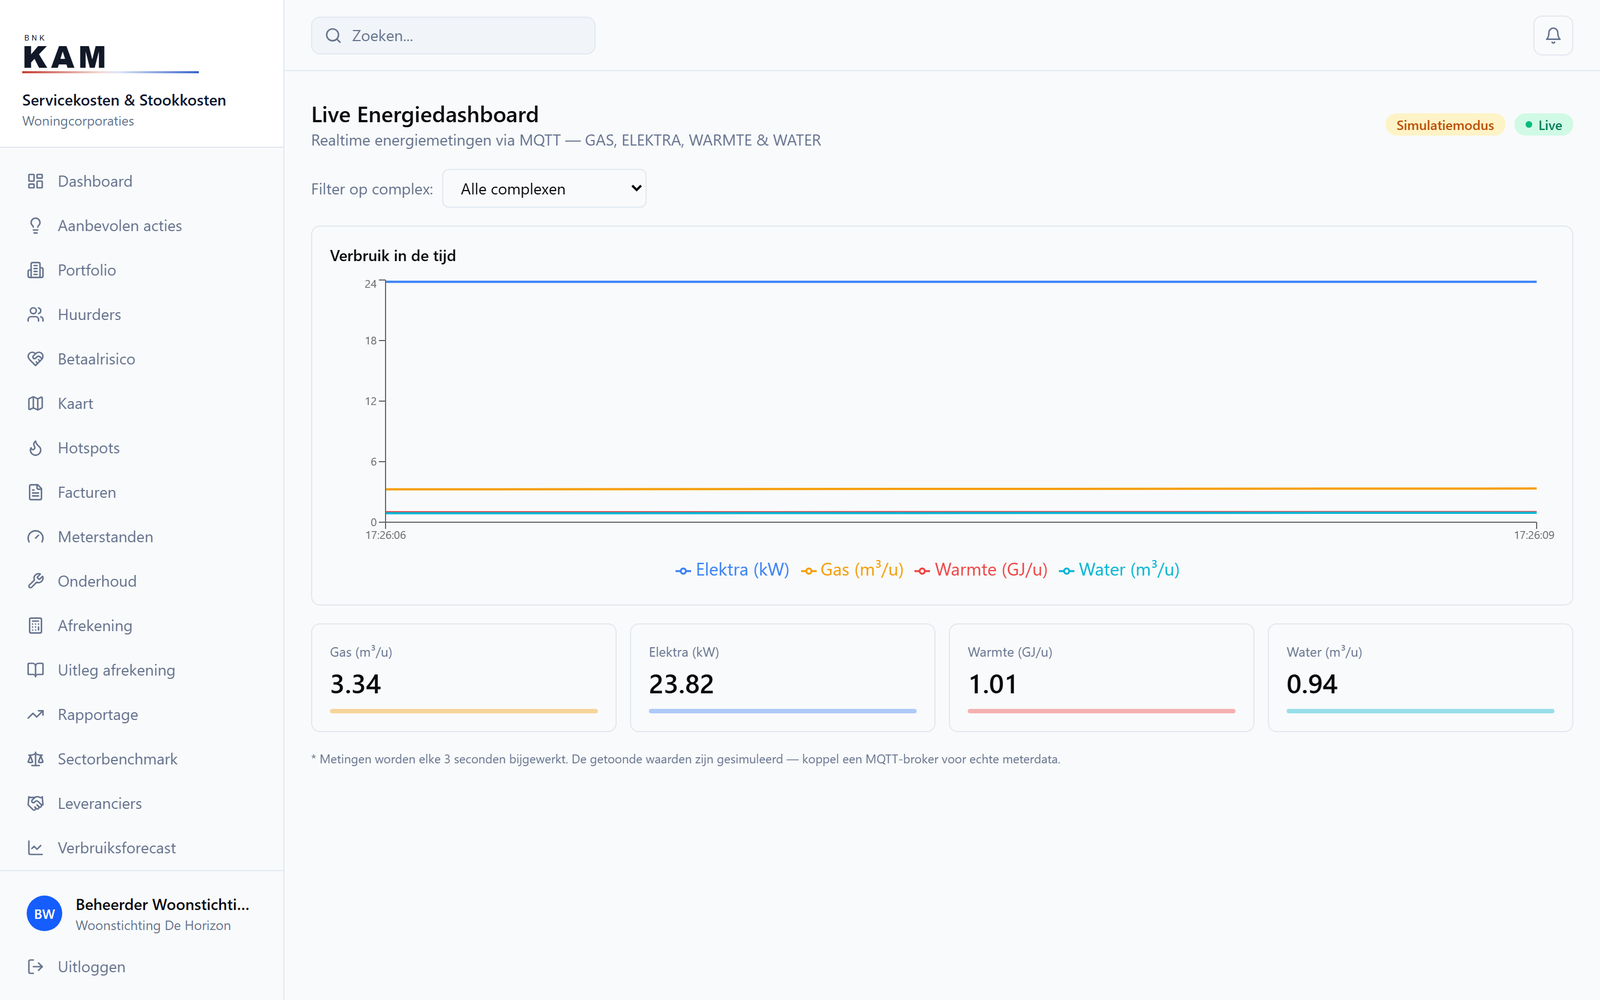
Alongside the daily registration and statement work, the dashboard offers a range of advanced analyses. Almost all calculations are deterministic and traceable to your invoices, meter readings and tenant data, no invented figures and no black box. Where we use real AI, the human stays in control. Swipe through the analyses, or tap one.




Act VI · Trust & technology
For housing associations, privacy is not a nice-to-have
The platform is built from the ground up with privacy-by-design as an architectural principle. Personal data is automatically masked before AI processing, each association's data is strictly separated, and every action is recorded traceably.
AI guardrails & transparency
The guardrails form the safety layer around KAM: on fixed rules, without any external AI call and therefore always verifiable, personal data is masked and manipulation attempts are blocked before text reaches the AI. And the transparency page shows, for every AI outcome, why it came about, with a model card per AI feature, the AI Act risk class and whether human oversight is required.
What this gives you: demonstrable compliance with the GDPR and the EU AI Act, explainable to tenant, accountant and regulator.


The sources: your own records, secure and structured
| Invoices | All supplier costs per complex and cost type, the basis of every statement. |
| Meter readings | Heat, gas, electricity and water consumption per home and complex. |
| Portfolio | Complexes, buildings, homes and tenants with allocation keys and advance payments. |
| Knowledge base | Warmtewet, NMDA, BW 7:259 and service charge rules, with source references. |
| Benchmark | Anonymised sector figures, protected with k-anonymity. |
Who builds the dashboard
The Service Charges & Heating Costs Dashboard is built by BNK KAM, a Dutch AI and data company that builds intelligent systems for sectors where regulation, expertise and data come together. Not a generic package with a thin layer of AI, but a platform designed from the foundations for the service charge and heating cost practice of housing associations, with uncompromising attention to privacy and responsibility.
EU AI Act: set up for human oversight and transparency
| Human oversight | Every sensitive outcome, such as a finalised statement, requires approval through the four-eyes principle. |
| Transparency | Every AI outcome is traceable and carries a source reference, with a model card per AI feature. |
| Accuracy | Almost all calculations are deterministic and traceable; the language model invents no figures. |
| Privacy | Automatic PII masking, tenant isolation, 2FA/SSO and a full audit log. |
| Traceability | Every action and AI action is recorded, so you can account for everything. |
As a deliberate and conservative choice, the platform is set up for the requirements of the EU AI Act for high-risk applications.
Why this dashboard, an honest comparison
| Feature | This dashboard | Spreadsheet (Excel) | Property package |
|---|---|---|---|
| Warmtewet & NMDA logic built in | ✓ By design | ✗ No | ⚠ Limited |
| Automatic allocation per allocation key | ✓ Per cost type | ⚠ Manual | ⚠ Partly |
| Explainable statement to the tenant | ✓ Traceable per item | ✗ No | ✗ No |
| Automatic anomaly & fraud detection | ✓ Built in | ✗ No | ✗ No |
| Auditable, full audit log | ✓ Every action | ✗ No | ⚠ Partly |
| PII masking & tenant isolation | ✓ By design | ✗ No | ⚠ Varies |
| Deterministic, no invented figures | ✓ Traceable | ✓ Calculates | ⚠ Records |
| Sector benchmark & subsidy scan | ✓ Built in | ✗ No | ✗ No |
| Knowledge stays when a member of staff leaves | ✓ Organisational memory | ✗ No | ⚠ Partly |
Act VII · In closing
Who is the dashboard for?
As an organisation, the dashboard serves housing associations, property managers and professional landlords who settle service charges and heating costs for rented property. Within those organisations it serves: service charge and administrative staff who process invoices, enter meter readings and prepare statements. Controllers and finance leads who want control over costs, budgets and anomalies. Management and board members who steer on performance, benchmarks and compliance. And customer contact and tenant representation teams who need clear, traceable explanations for questions and disputes.
Live demo
A 60-minute demonstration using one of your own complexes as an example.
Trial run
A guided start on your own data, so you see the effect straight away.
Implementation
A conversation about integrations, data entry and the setup for your portfolio.
Your context
We would be glad to show the dashboard with your complexes, allocation keys and figures.
Frequently asked questions
Does KAM make decisions about a statement on its own?
No. KAM is advisory and supportive. Every sensitive outcome, such as a finalised statement, requires human approval through the four-eyes principle. The final check and approval always rest with an authorised member of staff.
Where do the figures come from?
Almost all calculations are deterministic and traceable to your own invoices, meter readings and tenant data, no invented figures and no black box. Where real AI is used, the outcome is traceable and carries a source reference, and the human stays in control.
Does it comply with the Warmtewet and the service charge rules?
The Compliance module monitors adherence to the Warmtewet, BW 7:259 and the service charge rules, and the heating statement follows the NMDA method. Every item is traceably substantiated, ready for an assessment by the Huurcommissie or your accountant. For definitive legal advice, consult a specialist.
How is tenant data kept secure?
Personal data (BSN with eleven-test, IBAN, email, telephone, postcode) is automatically masked before AI processing. Each association's data is strictly separated (tenant isolation), access is role-based with two-factor authentication, and every action is recorded in an audit log. Benchmarks use k-anonymity.
Does it work without an external AI service too?
Yes. Where KAM normally reasons through the language model, without an AI key the system falls back to a deterministic calculation on the same data. The platform stays usable and verifiable at all times.
How quickly can I see something?
You can book a 60-minute demonstration using one of your own complexes as an example, or start with a guided trial run on your own data.
Transparent statements. Fair costs. Full control.
The sector is changing, and AI is no longer a distant prospect. Housing associations that commit today to transparent, verifiable statements build both the trust of their tenants and control over their costs. We would be glad to show you how the dashboard makes your statements faster, more accurate and easier to explain.